Investment Planning
Financial Markets Performance Review (2025)
Every quarter, I write about the recent quarter's performance to give you perspective on what happened with your investment portfolios.
February 8, 2026
Table of Contents
Every quarter, I write about the recent quarter's performance to give you perspective on what happened with your investment portfolios. Instead of just covering Q4, 2025, I want to go over 2025 as a whole and look ahead to what may happen in 2026. Let's dive in.
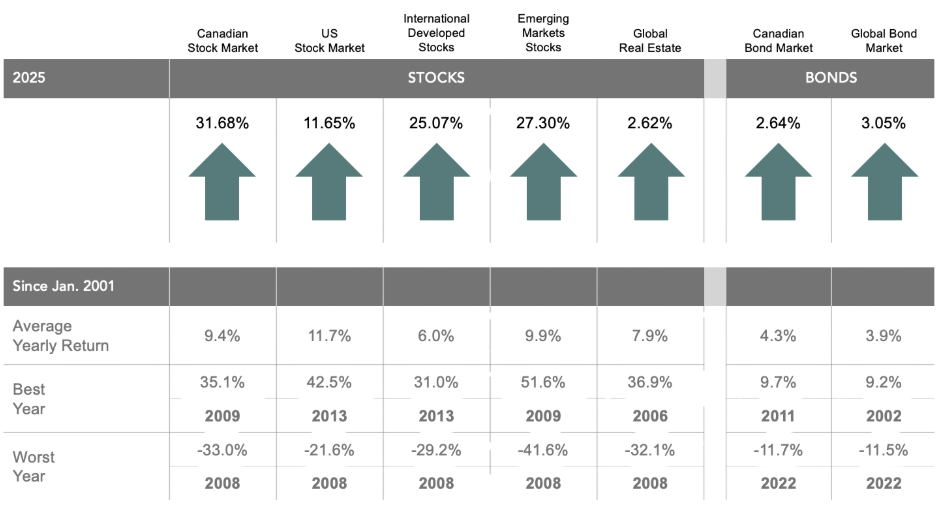
Stocks (2025)
- Canadian stocks led, returning +31.7%, well above their long-term average of ~9.4%
- U.S. stocks delivered a solid +11.7%, roughly in line with their historical norm, but massively underperformed other markets
- International developed (+25.1%) and emerging markets (+27.3%) both posted standout years, significantly exceeding long-term averages
- Global real estate lagged at +2.6%, despite a long-term average near 8%
Equity index returns in 2025 were strong and broadly diversified, not driven by a single region, for investors who were properly diversified. One of the most common mistakes I see with new clients is trying to time specific countries or regions. When leadership inevitably rotates, they often miss the rebound in the areas they don’t own, sometimes by a wide margin.
Bonds (2025)
- Canadian bonds: +2.6%
- Global bonds: +3.1%
Bond index returns were below their long-term average (around 4%), but remained positive. Bonds did exactly what they’re meant to do: provide stability and income, not growth. Another common mistake I see with new clients is an over-allocation to fixed income or cash (often GICs) that’s misaligned with long-term goals like retirement. Parking $250,000 in a GIC instead of equities for 10+ years can quietly cost hundreds of thousands of dollars in lost opportunity.
Bonds’ diversification benefits vary over time as correlations change

This chart shows that in a balanced 60/40 portfolio (a US-focused portfolio), bonds usually reduce overall risk, but the diversification benefit has varied historically. During the 2000-2020 period, that benefit was greater than the previous 20-year period.
The fluctuation in the stock-bond diversification benefit doesn't mean you should start including all sorts of alternative assets in your portfolio, as many Portfolio Managers use this approach as a sales pitch to replace your bond position. I will cover why you shouldn't in more detail in subsequent newsletters.
The takeaway is that bonds still carry risk; hence, having the right asset allocation between equities, bonds, and cash that is aligned with your goals is key to having peace of mind with your money.
Country Returns (2025)
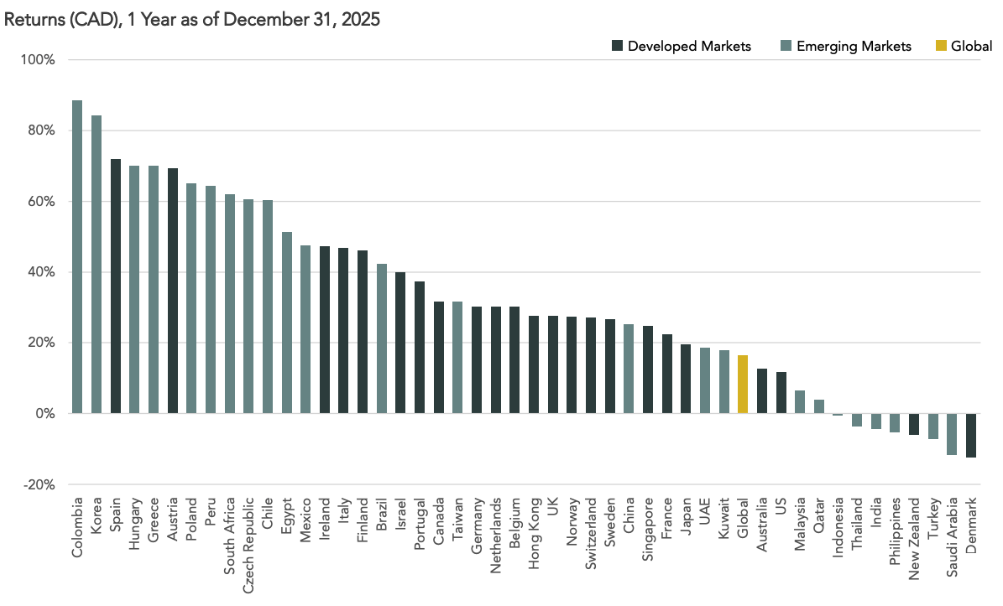
Top Performers
- Colombia and Korea led global markets, posting returns near or above 80–90%.
- Several emerging and smaller developed markets followed with gains in the 50–70% range.
These outsized returns came largely from cyclical rebounds and country-specific factors.
Middle of the Pack
- Most developed markets, including Canada and Europe, delivered solid but more moderate gains. These returns clustered around the 20–40% range.
- The global equity market is highlighted in yellow.
Lagging Markets
- A handful of countries finished flat or negative.
- India, the Philippines, Turkey, Saudi Arabia, and Denmark were among the weakest performers.
Trying to guess which countries will lead next year is extremely difficult. This chart highlights why:
- Concentrated country bets can lead to very uneven outcomes.
- Broad global diversification smooths results and reduces reliance on any single market.
To be a successful long-term investor, the goal isn’t to chase last year’s top performer; it’s to implement an investment strategy that can consistently capture global market returns without needing to predict where the next surge will come from.
Sector Returns Overview (2025)
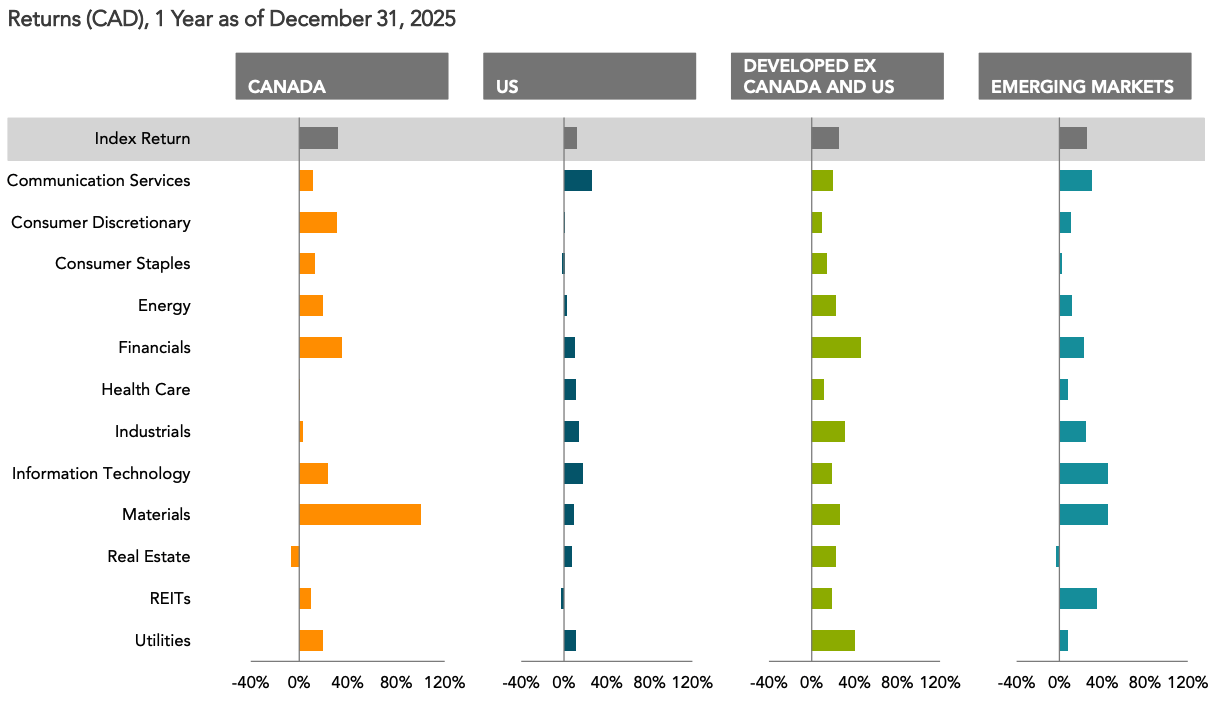
Sector leadership varied widely by region in 2025. Canada’s returns were driven mainly by Materials and Financials, while the U.S. was more concentrated in Communication Services and Technology. Outside North America, Info Tech, Financials, Materials, and REITs played a larger role, especially in emerging markets, highlighting the benefit of global sector diversification.
Factor Performance Global Equity Market
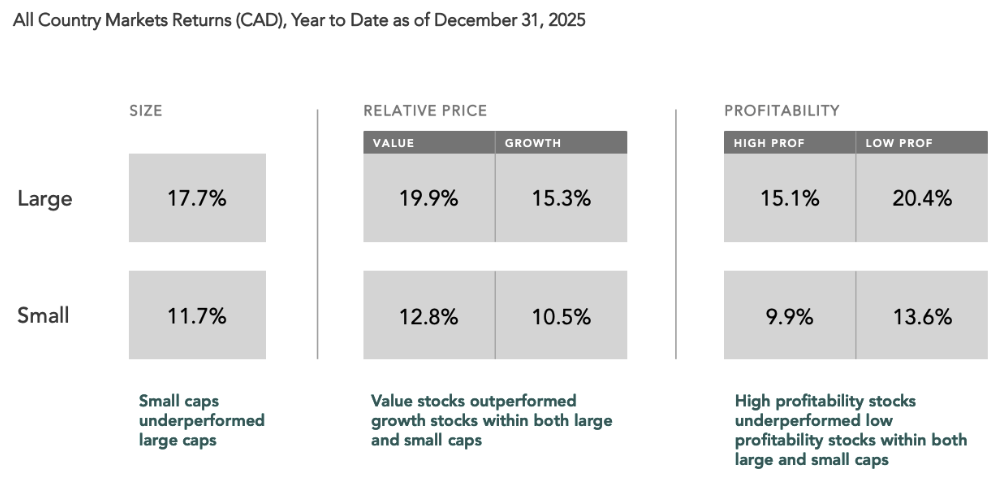
In 2025, large-cap stocks outperformed small caps, while value stocks beat growth across both size segments. At the same time, lower-profitability companies outperformed higher-profitability ones, reflecting a shift toward more cyclical and risk-tolerant market leadership. The takeaway is that factor leadership rotates. Staying diversified across size, value, and profitability matters more than betting on last year’s winners.
Wide Valuation Gap Between Asset Classes
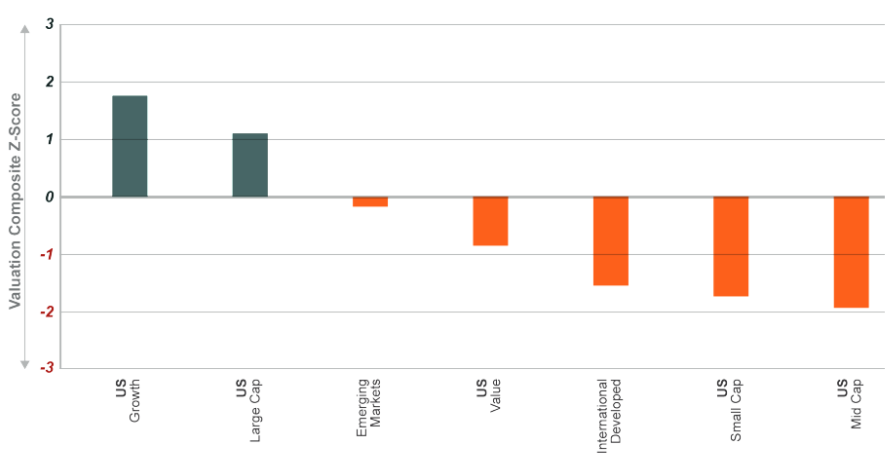
This chart shows a wide valuation gap heading into 2026. U.S. growth and large-cap stocks remain expensive, while international, small-cap, mid-cap, and value stocks are priced well below historical averages.
Opportunity in 2026: Forward-looking return potential appears stronger outside the most popular U.S. growth segments, reinforcing the case for global diversification and balanced factor exposure rather than concentration in the largest US Mega Cap stocks.
Volatility Is The Toll We Pay To Invest
S&P 500 Various Declines Per Year (1928-2024)
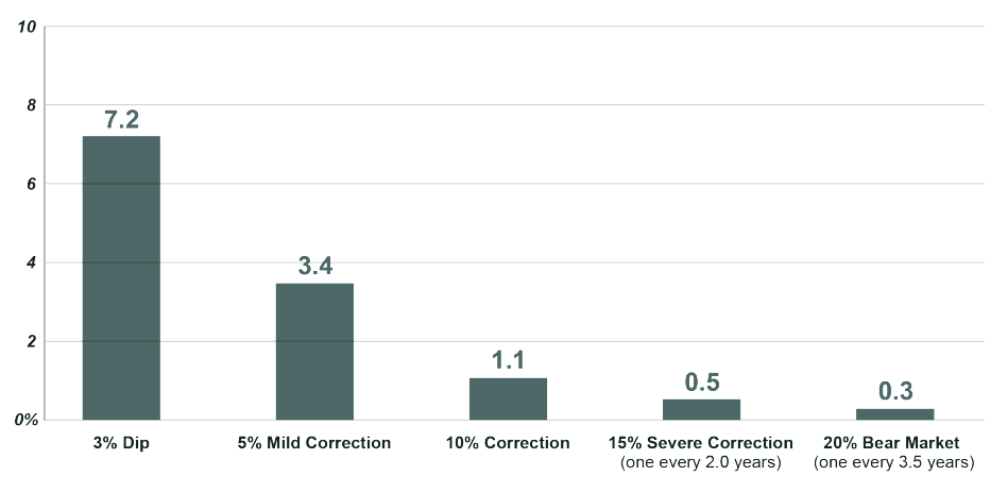
Small market pullbacks are common, while major declines are rare. A 3–5% dip happens frequently (7 times per year), but 10%+ corrections are much less common (1 time per year), and true bear markets (20%+) occur only occasionally (once every 3.5 years). The takeaway is that market volatility is normal, and short-term declines are the cost of earning long-term returns.
Bull Markets Last Longer Than You Think
Length of bull markets (months) and when they started.
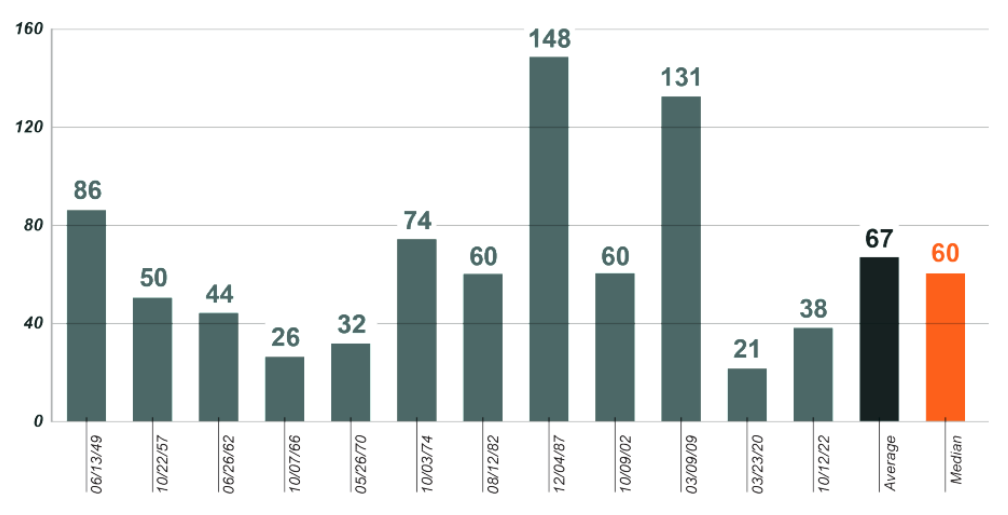
The bull market turned 3 years old in October and entered its 4th year, which, on the surface, might feel old, but it is still a fairly young bull market. In fact, looking at the 11 bull markets since World War II, the average one lasts more than five years. Will this time be different? We shall see...
Millen Wealth Recommended Global Portfolios
Calendar Returns, CAD. Net of Investment fees. Gross of Advisor Fees.
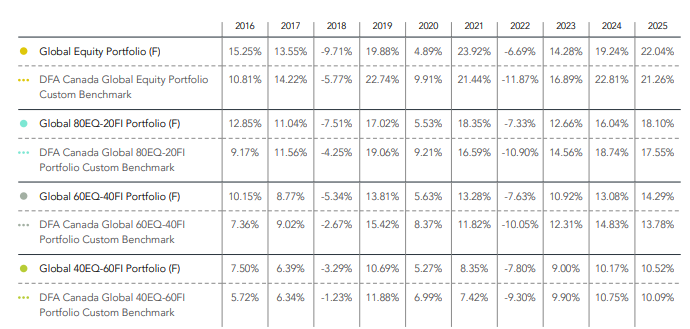
To help clients achieve their various financial goals, we recommend these portfolios, which are managed using an evidence-based investment philosophy. If you are a Millen Wealth investment client, your specific portfolio performance will be reflected on your statement. And if you are not a client and would like to explore further how Sam and I manage money for business owners and high-income professionals as part of our holistic, planning-focused approach, please message me, and we can have a private conversation.
Have a great week!